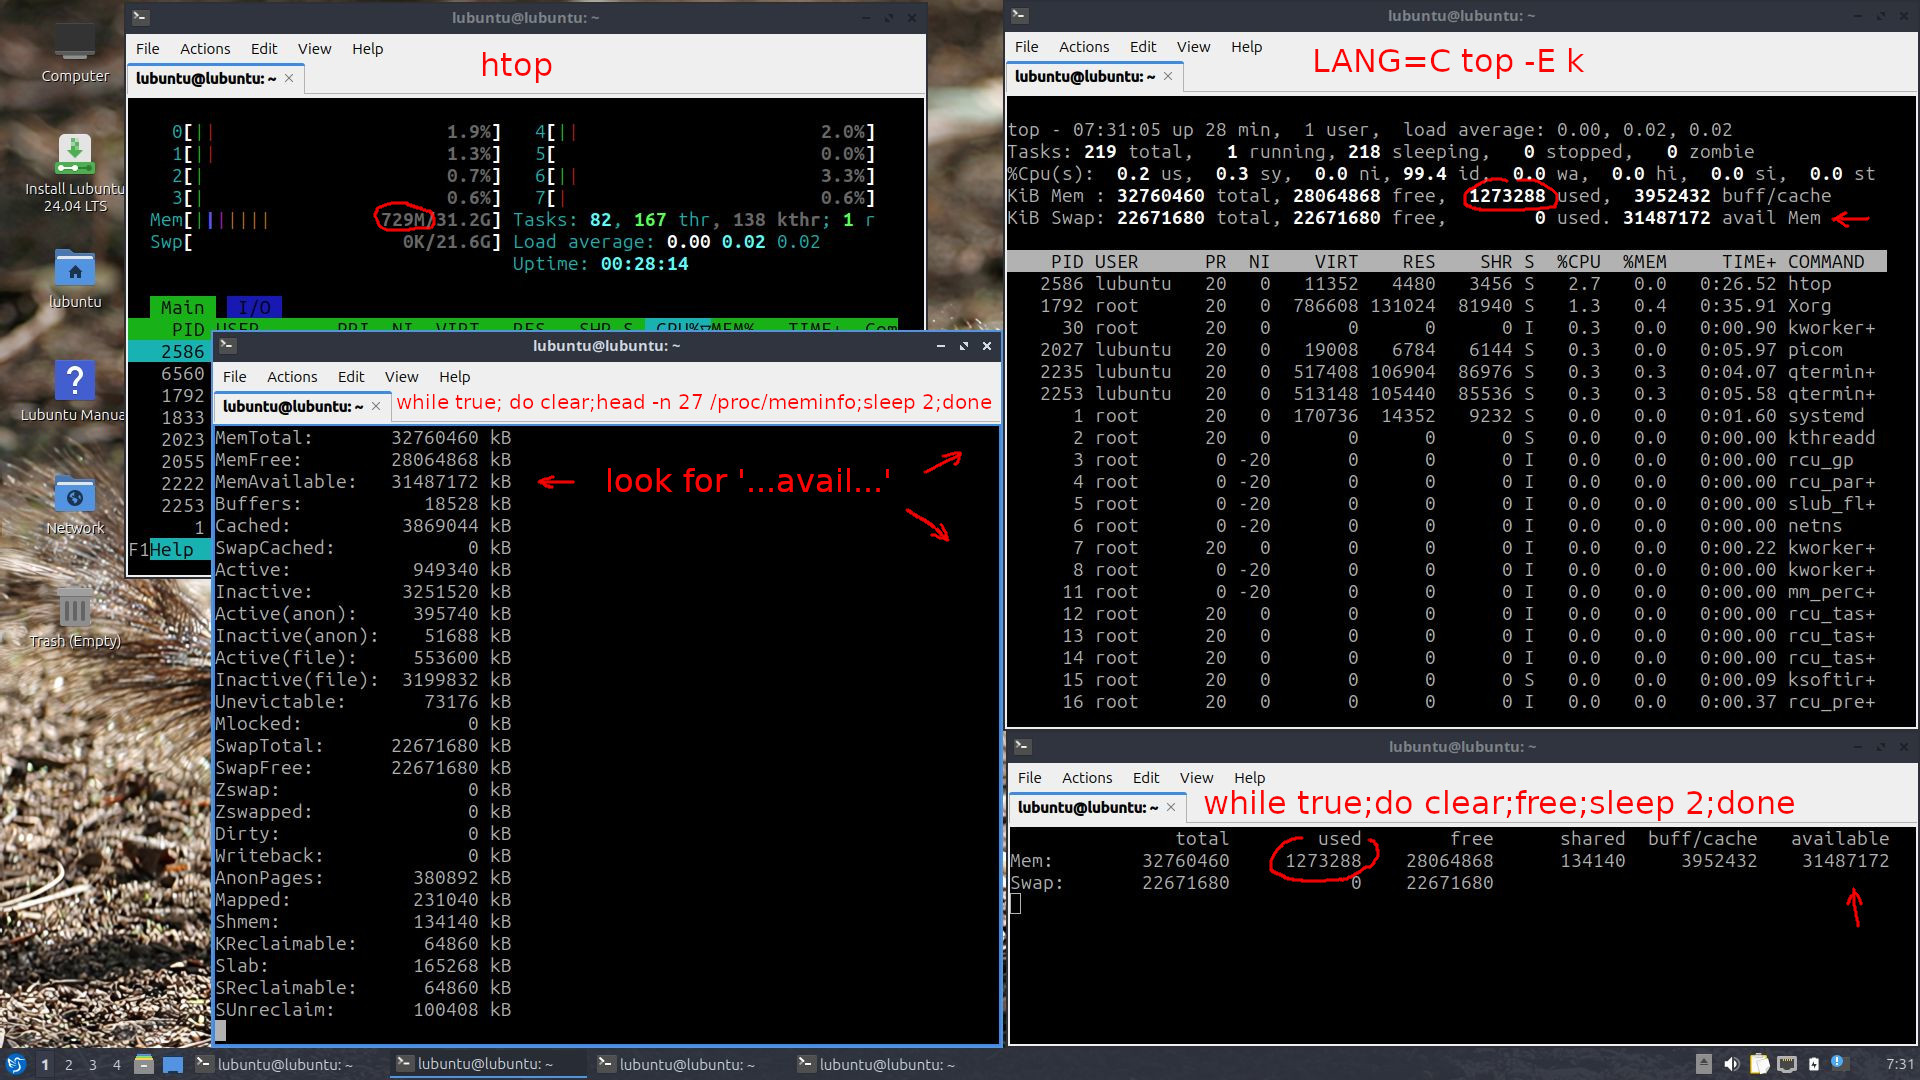
Checking for used RAM can be confusing because different tools show different results. Can you explain how to interpret the results marked red in the screenshot below? The windows show the output from htop and free -m
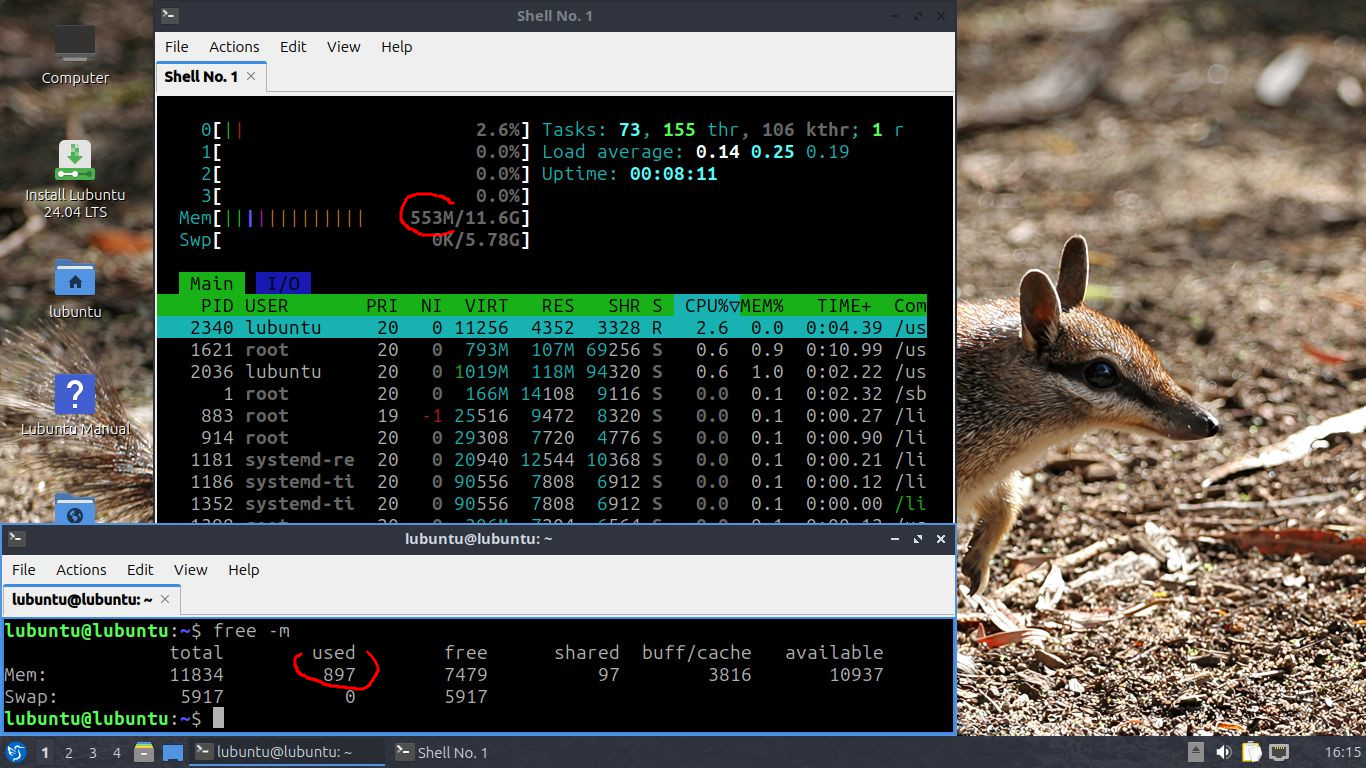
I rebooted the live Lubuntu Noble system in the same Toshiba Satellite Pro C850-19W, and the command history was different (for example installed ‘gnome-terminal’ in order to mark and copy ‘htop’), and I had the following result, now as text (to make it easier for you to use the data), now with a greater difference, ‘free’ indicates approx. twice as much used RAM as ‘htop’.
* free -mw: 1106 M
------------------
lubuntu@lubuntu:~$ free -mw
               total        used        free      shared     buffers       cache   available
Mem:           11834        1106        6909         294          15        4369       10727
Swap:           5917           0        5917
--------------------------------------------------------------------------------------------

* htop: 533 M
-------------
    0[|                                 2.6%] Tasks: 80, 173 thr, 105 kthr; 1 running
    1[|                                 0.6%] Load average: 0.03 0.09 0.15
    2[|                                 0.6%] Uptime: 00:27:28
    3[|                                 0.6%]
  Mem[||||||||||||||||||          533M/11.6G]
  Swp[                              0K/5.78G]

  [Main] [I/O]
    PID USER       PRI  NI  VIRT   RES   SHR S  CPU%▽MEM%   TIME+  Command
   1396 root        20   0  788M  107M 65556 S   1.9  0.9  0:34.71 /usr/lib/xorg/Xorg -nolis
   2658 lubuntu     20   0  611M 50248 39716 S   1.3  0.4  0:04.48 /usr/libexec/gnome-termin
   2730 lubuntu     20   0 11348  4608  3584 R   2.6  0.0  0:08.45 htop
   1431 root        20   0  788M  107M 65556 S   1.3  0.9  0:05.02 /usr/lib/xorg/Xorg -nolis
   1792 lubuntu     20   0 1196M  109M 90304 S   0.0  0.9  0:04.04 /usr/bin/pcmanfm-qt --des
   1725 lubuntu     20   0  439M 28720 22296 S   0.0  0.2  0:02.18 /usr/bin/openbox
   1806 lubuntu     20   0 1196M  109M 90304 S   0.0  0.9  0:00.44 /usr/bin/pcmanfm-qt --des
      1 root        20   0  166M 14320  9200 S   0.0  0.1  0:03.45 /sbin/init splash ---
    848 root        19  -1 25528  9216  8320 S   0.0  0.1  0:00.29 /lib/systemd/systemd-jour
    879 root        20   0 29304  7576  4504 S   0.0  0.1  0:02.19 /lib/systemd/systemd-udev
   1124 systemd-re  20   0 20940 12544 10368 S   0.0  0.1  0:00.19 /lib/systemd/systemd-reso
F1Help  F2Setup F3SearchF4FilterF5Tree  F6SortByF7Nice -F8Nice +F9Kill  F10Quit
Can this be explained, or should we suspect that one of the tools is buggy in Noble? I do not see such differences in Ubuntu 22.04.3 LTS (Jammy).
What about the content of /proc/meminfo ? Would it be more relevant to look at its listed value for MemAvailable (rather that some estimate of ‘used RAM’)?
Edit: See the discussion at this link:
It confirms that we can expect differences between the output of the tools. The content of /proc/meminfo is relevant, particularly MemAvailable, and in the output of free the column headed by available, and in the output of top the data next to 'avail Mem'.
I looked further into what happens with Lubuntu Noble this time booted live in a Dell Dimension M4800, and would still be happy to get help here too interpret the result (the big difference between htop and free).